How to Trade Using Bullish Engulfing Candlestick Analysis "TRADING STRATEGY FOR BEGINNERS"
After previously discussed trading strategies using the "Bullish Gravestone Doji" candlestick analysis, on this occasion I will share again a trading strategy using the Bullish Engulfing Candlestick analysis technique. This strategy is very suitable and easy to use for beginners. Although this candlestick pattern has a medium level of accuracy, if we use a confirmation candle the results will be very accurate.
Bullish Engulfing candlestick is a signal that the trend is being (Bearish) which has been going on for a long time and will end soon. The trend (Bullish) will start soon, or it can be called the Bullish Engulfing candlestick pattern is a sign that there will be a price reversal in a market. Previously I have discussed that the reversal point from Bearish to Bullish is the most appropriate point for us to make a purchase.
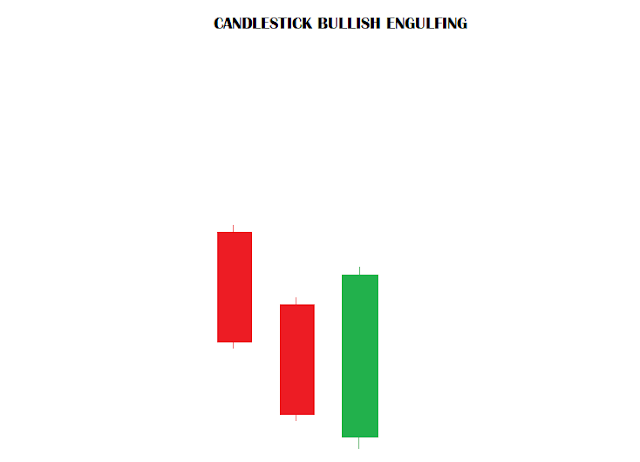
For more details on getting to know Bullish Engulfing, let's look at the image of the Bullish Engulfing candlestick pattern below.
 |
| bullish engulfing candlestick |
From the picture above, we can see a red candlestick with a long stem and a blue candlestick with a longer trunk. Seen from the blue candlestick includes the red candlestick that was formed previously, to facilitate this discussion, I will assume that This candlestick pattern is formed in the daily timeframe.
On the first day, a red candlestick with a long trunk is formed. This means that this candlestick tells us that the Bearish trend is still continuing its dominance. It is predicted that the Bearish trend will still dominate the price the next day. Fortunately, what we predicted was proven wrong. What happened in the market was a red candlestick, on the second day, a blue candlestick was formed with a longer bar than the first day's candlestick.
This means that it tells us that on the second day, it turned out to be a Bullish candlestick that dominated the price. It can be said that there is no resistance from the candlestick Bearish. Bullish candlesticks can push deep into the area previously controlled by the Bearish candlestick. Here we have predicted that the bullish candlestick will continue to dominate the price battle of a market in the following days.
However, what I have said based on statistics, is that this Bullish Engulfing candlestick pattern has a high level of accuracy or is still medium. Here there may be still a chance that the Bearish candlestick can make a strong counterattack the next day. To avoid something like this, and to improve the certainty of the results of our analysis, we better wait for confirmation before making a purchase.
Bullish Engulfing Candlestick Confirmation Pattern Form
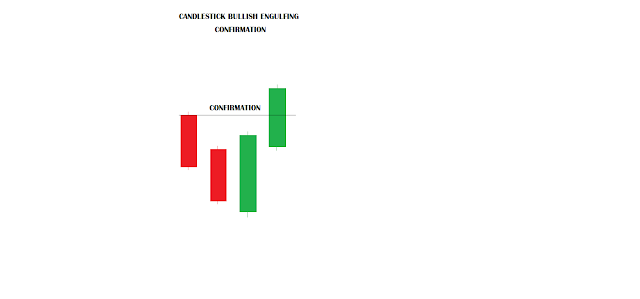
So that we understand more about the Bullish Engulfing candlestick pattern confirmation, let's look at the image below.
 |
| Bullish Engulfing Candlestick Confirmation Pattern |
In the picture we see above, there has been a blue candlestick that has a long bar and I have marked it with a confirmation line. The blue candlestick
is seen breaking above the confirmation line. This means that in this case, it tells us that the strength or pressure of the Bullish candlestick has been confirmed to be much stronger than the strength Bearish candlestick. We can predict that the Bullish candlestick has dominated the Bearish candlestick, and this dominance will last for a long time in the future. Prices will continue to push up in the future, and this is the right moment for us to make a purchase (UP).
Maybe that's all I can share about how to trade using Bullish Engulfing candlestick pattern analysis, this strategy is very suitable and easy to apply by us as traders beginners. Hopefully, the strategy that I share can help you in doing analysis in trading.
Post a Comment for "How to Trade Using Bullish Engulfing Candlestick Analysis "TRADING STRATEGY FOR BEGINNERS""