The Most Powerful Tradingview Buy/Sell Indicator
In this article, we will discuss one of the most powerful buy/sell trade display indicators. We will provide information on how to use this trading indicator.
The trading indicator that we will discuss in this article is the "ut bot indicator" besides that we will use the "EMA 200" indicator which functions as a trend filter indicator.
In this article there are several things that we will learn including the following:
- How to install the "ut bot" indicator
- How to place the "EMA 200" indicator
- How to read trading signals when using the ut bot and "EMA 200" indicators
How to Install "Ut Bot" Indicator
For how to install the "ut bot" indicator, first open your trading chart. In this article, we will use XAU USD or gold chart with an hour time frame. The reason we use this indicator on the XAU USD trading chart is, it works well on the XAU USD chart.
 |
| UT BOT Indicator |
 |
| UT BOT Indicator |
To make it more convenient to use, we can set this indicator. The first way, please click the settings menu on the ut bot indicator, the next step is to click the style menu on the ut bot indicator. after that please turn off the trailing stop option, if it is click ok in the lower right corner. if you do the steps correctly then your trading chart will look like this.


How to Place the 200 EMA Indicator
In this discussion, the "EMA 200" indicator serves as a trend filter. how to place the "EMA 200" indicator, first click the indicator menu above the search menu. Please write down the exponential moving average, then click on the exponential moving average indicator option. After that close the search menu, then change the length of the period from nine to 200.


The way the ut bot trading indicator works is actually very simple. We will make a buy entry when the green candle and label appear on our trading chart. Meanwhile, you will make a cell entry when a red candle and cell label appear on your trading chart.
However, for this trading strategy, We will add the “200 EMA” indicator which has a role as a trend filter indicator. This means we will make a buy entry when the green candle and the buy label appear then the price position is above the "200 EMA" line.
Instead, we will enter the cell when the red candle and the cell label appear, then position the price below the "EMA 200" line. So with the help of the “200 EMA” line, the winning rate of this trading strategy will increase.
How to read trading signals when using the ut bot and "EMA 200" indicators
To make it easier for you to understand what We said above, We will give examples of "BUY" entry rules with exit rules as well as "SELL" entry rules and "SELL" exit rules.
Example for with "BUY" entry rule and the "BUY" exit rule.

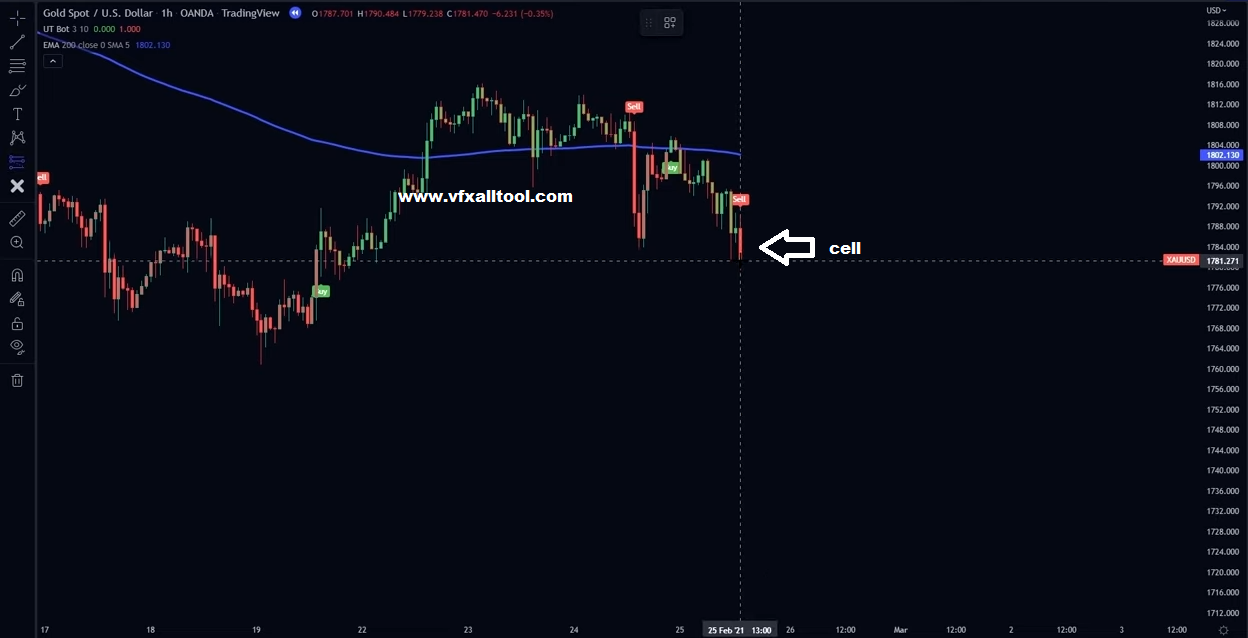
Examples of the "SELL" entry rule and "SELL" exit rule.
That's the strategy that we can share in this article, hopefully, you can understand what we're telling you. Be wise in using any strategy. Remember trading has a very high risk.
Post a Comment for "The Most Powerful Tradingview Buy/Sell Indicator"