Simple and Effective Forex Trading Strategy with Bollinger Bands and RSI
Master the Forex trading strategy with a high success rate using Bollinger Bands and RSI! This beginner-friendly guide explains how to set up indicators and identify entry points for long and short trades based on price movements and overbought/oversold conditions.
Tired of complicated trading strategies? This method offers a direct approach to analyzing the market and making informed decisions. Learn how to harness the power of Bollinger Bands for support and resistance, as well as use RSI to gauge overbought and oversold zones.
Setting up the RSI indicator with certain parameters
This method's first step is setting up the Bollinger Band indicator. This indicator is a great way to find support and resistance levels. If you have, then you should change it for this strategy. The first thing is to go to the long section and change this value to 30, ensuring the default division is set to 2. For more details please see the image below.

How Bollinger Band Indicator Works

Next, add the RSI indicator. To do this, you can go to the indicator tab, type RSI and then add it. If you've already added an RSI indicator, let's change it a bit for the settings. The upper band paste is set to 70, and for the lower band, it is set to 30. Then for the length of 14, but for this strategy be sure to change it to 13. For more details, please see the image below.

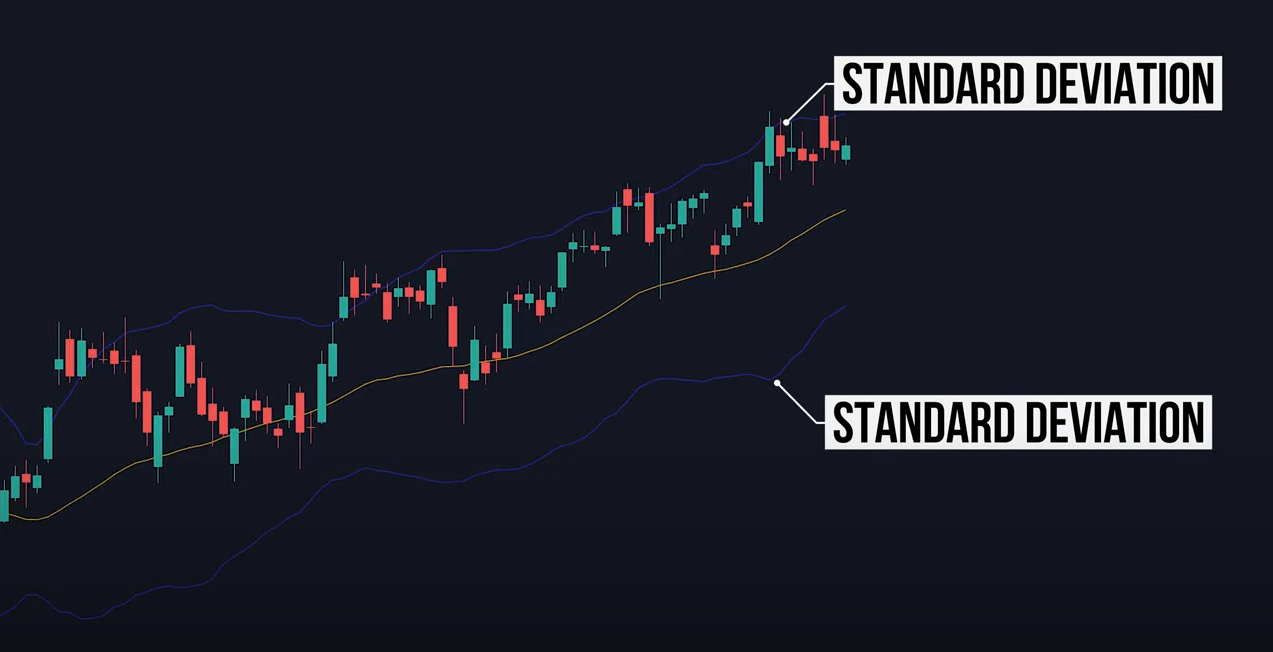
For example, in most cases, if there is an extreme price rush in one direction whether it is up or down, we can predict that after that big price movement, the price will return to its average. So, if the price is above the upper Bollinger Band, we want to enter a short trade. But if the price is below the Bollinger Band indicator below, We can enter a long trade.

Post a Comment for "Simple and Effective Forex Trading Strategy with Bollinger Bands and RSI"